
Australia's greenhouse gas emissions have fallen substantially from their mid-2000s level, but the transition is far from complete. Electricity is becoming cleaner, while emissions from transport, industry, resources and agriculture present different — and in some cases more difficult — challenges.
Understanding Australia's emissions profile means looking beyond a single national number. Different sectors produce greenhouse gases for very different reasons, respond to different technologies and policies, and are moving at different speeds.
- National emissions were estimated at 455.6 million tonnes of CO₂-e in the year to March 2026.
- Electricity emissions fell 3.7% over the year as renewable generation increased and displaced coal and gas.
- Fugitive emissions from coal, oil and gas activity fell 3.3%.
- Agricultural emissions fell 1.0%, while transport emissions increased slightly.
- Industrial-process emissions increased 2.1%, driven primarily by increased steel production.
- Emissions per person are substantially lower than they were in 2005, but significant further reductions are required to meet Australia's future targets.
How much greenhouse gas does Australia emit?
Australia's National Greenhouse Gas Inventory estimated emissions of 455.6 million tonnes of carbon dioxide equivalent (Mt CO₂-e) for the year to March 2026.
That represented a reduction of 7.5 Mt CO₂-e, or 1.6%, compared with the previous year. Australia's annual emissions were approximately 25% below 2005 levels.
Preliminary government estimates for the year to June 2026 put national emissions slightly lower again, at around 452.4 Mt CO₂-e. Because that figure is preliminary, it will be revised as more complete inventory data becomes available.
These figures include carbon dioxide as well as other greenhouse gases such as methane, nitrous oxide and fluorinated gases. They are converted into carbon dioxide equivalent so their climate impact can be expressed using a common measure.
Where do Australia's emissions come from?
There is no single source of Australian greenhouse gas emissions. The national inventory divides emissions among major sectors including electricity, stationary energy, transport, fugitive emissions, industrial processes, agriculture, waste and land use.
The distinction matters because the pathway to lower emissions is different in each sector.
Electricity generation
Coal and gas-fired power generation has historically been one of Australia's largest sources of emissions. This sector is now changing rapidly as wind, solar, batteries and other lower-emissions sources increase their share of generation.
Transport
Cars, trucks, aviation and other transport activity remain major consumers of petroleum fuels. Electrification and vehicle efficiency can reduce road-transport emissions, while aviation and heavy transport present more difficult challenges.
Fugitive emissions
Coal mining and oil and gas production can release methane and other greenhouse gases independently of the fuel eventually being burned. These releases are recorded as fugitive emissions.
Industry
Steel, cement, chemicals and other industrial activities create emissions through both energy use and chemical processes. Some industrial emissions are particularly difficult to eliminate with existing technologies.
Agriculture
Agriculture produces significant methane and nitrous oxide emissions, particularly from livestock, soils and fertiliser use. Its emissions profile is therefore very different from the electricity sector.
Land use and forestry
Changes in forests, vegetation and land management can either release greenhouse gases or remove carbon dioxide from the atmosphere, making the land sector an important part of Australia's overall emissions balance.
Electricity is driving much of the recent decline
The electricity sector is currently one of the clearest examples of structural emissions reduction in Australia.
In the year to March 2026, electricity emissions fell by 3.7%, equivalent to approximately 5.6 Mt CO₂-e. The national inventory attributed the decline to record renewable generation and the continuing displacement of coal and gas-fired electricity.
Why electricity matters
Decarbonising the electricity system has an effect beyond power generation itself. Cleaner electricity can also reduce emissions elsewhere as vehicles, household heating, industrial equipment and other technologies become increasingly electrified.
This makes the electricity transition a foundation for emissions reductions in other parts of the economy.
Transport is becoming a bigger challenge
Transport follows a different trajectory. Australia's large distances, dispersed cities and reliance on road freight have historically made the sector heavily dependent on liquid fossil fuels.
Transport emissions increased slightly — by 0.2% — in the year to March 2026. Higher diesel use in road transport and increased domestic aviation activity outweighed lower petrol consumption.
Over the longer term, electric vehicles and more efficient cars can reduce road-transport emissions. Australia's New Vehicle Efficiency Standard is also expected to contribute to future reductions.
Heavy freight, shipping and aviation are harder to decarbonise because batteries are not suitable for every application and alternative fuels remain at different stages of commercial development.
Resources and fugitive emissions
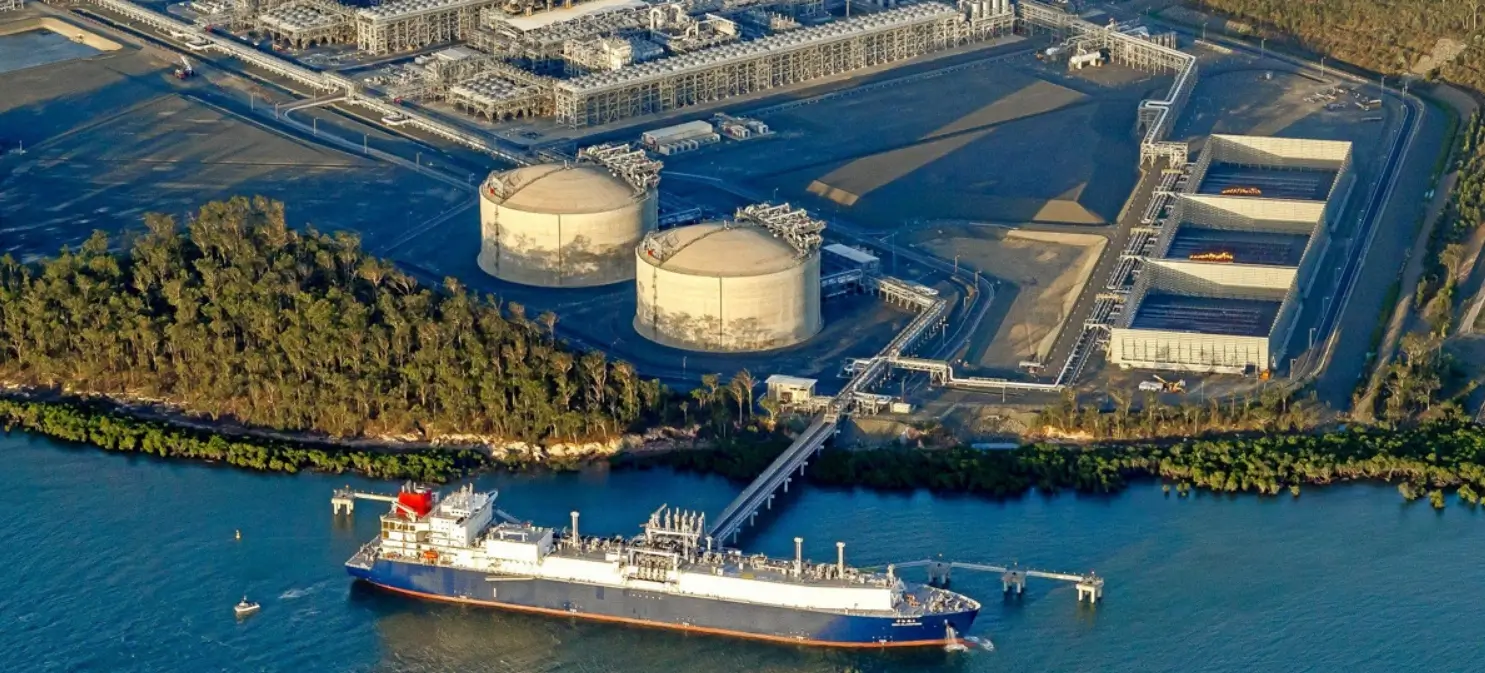
Australia's role as a major coal and liquefied natural gas exporter creates another distinctive part of the national emissions profile.
Fugitive emissions occur during the extraction, processing and transport of fossil fuels. Methane released from coal mines and natural gas operations can be particularly important because methane is a powerful greenhouse gas.
Fugitive emissions fell by 3.3% in the year to March 2026. The national inventory attributed much of the decline to reduced natural-gas venting, new carbon capture and storage activity and lower production from underground coal mining.
Industrial emissions are harder to eliminate
Some emissions are created not simply because a factory uses fossil-fuel energy, but because greenhouse gases are produced by the industrial process itself.
Steelmaking, cement production and chemical manufacturing are prominent examples.
Industrial processes and product-use emissions increased by 2.1% in the year to March 2026, primarily because of increased steel production.
These sectors are among the areas where Australia's industrial emissions policies, including the Safeguard Mechanism, become particularly important.
How does Australia put a price on industrial emissions?
Our guide explains the Safeguard Mechanism, emissions baselines, ACCUs and the evolution of carbon pricing in Australia.
Emissions Trading and Carbon Pricing in Australia →Agriculture has a very different emissions profile
Australian agriculture cannot be understood simply through fossil-fuel consumption.
A large share of agricultural emissions comes from biological processes. Livestock produce methane through digestion, while agricultural soils and fertilisers can produce nitrous oxide.
Agricultural emissions fell by around 1.0% in the year to March 2026, primarily because grazing cattle and sheep numbers were lower.
Year-to-year agricultural emissions can also be affected by rainfall, drought, herd size and other seasonal conditions, making the sector more variable than some parts of the economy.
Australia's emissions have fallen since 2005
The long-term trend is clearer than any individual quarterly movement.
By the year to March 2026, Australia's greenhouse gas emissions were approximately 25% below 2005 levels.
Emissions intensity — the amount of greenhouse gas pollution generated for each unit of economic output — has fallen even faster. In the year to March 2026, Australia's emissions intensity was 55.3% below its 2005 level.
Emissions per person were also 45.7% lower than in 2005.
That means the Australian economy and population have grown while emissions have not increased at the same rate. However, declining emissions intensity is not the same as reaching net zero: absolute emissions still need to fall substantially.
How far does Australia still have to go?
Australia's 2030 target is to reduce greenhouse gas emissions by 43% below 2005 levels.
Its 2035 target is a reduction of 62–70% below 2005 levels, followed by a national goal of net zero emissions by 2050.
By the March 2026 inventory update, Australia had used approximately 60% of its 2021–2030 emissions budget.
The challenge is that the easiest reductions will not necessarily be available indefinitely.
Electricity emissions can fall quickly as renewable generation replaces fossil-fuel power. Deeper national reductions increasingly require progress in transport, resources, industry, agriculture and the built environment as well.
What do current projections show?
Government projections indicate that electricity is expected to deliver some of Australia's largest emissions reductions over the remainder of the decade.
Under the policies incorporated into Australia's 2025 emissions projections, electricity-sector emissions are projected to decline by more than 60% between 2025 and 2030.
Transport emissions are also projected to decline, supported in part by the New Vehicle Efficiency Standard.
Other sectors are more difficult. Agricultural emissions are projected to remain comparatively stable, while some stationary-energy and resource emissions can rise in the short term before declining.
The projections therefore illustrate an important feature of Australia's transition: progress will not occur evenly across the economy.
Australia in the global climate context
Australia's total annual emissions are only one way of evaluating its climate footprint.
Population size, economic structure, energy use, exports and historical emissions all influence comparisons between countries. Australia has a relatively small population but an economy with substantial mining, resource processing, transport and historically coal-intensive electricity generation.
This means Australia's climate debate has long involved two questions at once: how quickly domestic emissions should fall, and how an emissions-intensive, export-oriented economy should adjust as global energy systems change.
The historical review explored Australia's emissions, economic exposure and role in international climate action. Explore the original 2008 Garnaut Climate Change Review →
Why Australia's emissions profile is changing
Australia's emissions profile is gradually shifting away from the pattern that dominated much of the twentieth and early twenty-first centuries.
Renewable electricity is expanding. Coal-fired generation is being progressively displaced. Electric vehicles are increasing their share of new vehicle sales. Industrial facilities face tighter emissions constraints, while energy efficiency and electrification are changing buildings and equipment.
But the transition also exposes harder problems.
Reducing methane from agriculture and resources, decarbonising heavy industry, replacing fossil fuels in heavy transport and maintaining reliable electricity while retiring ageing coal generation all require different combinations of technology, infrastructure, investment and policy.
The key takeaway
Australia's greenhouse gas emissions are moving downward, but the national figure hides major differences between sectors.
Electricity is currently providing some of the clearest reductions as renewable generation displaces coal and gas. Other parts of the economy — particularly transport, resources, heavy industry and agriculture — face more complex pathways.
That distinction will become increasingly important as Australia moves from its current emissions level toward its 2030 and 2035 targets.
The next phase of Australia's climate transition is therefore not simply about building more renewable electricity. It is about using cleaner electricity, new technologies, carbon markets, infrastructure and changes in production to reduce emissions throughout the wider economy.
Frequently asked questions
How much greenhouse gas does Australia emit?
Australia's National Greenhouse Gas Inventory estimated 455.6 Mt CO₂-e of emissions in the year to March 2026. Preliminary estimates put emissions at approximately 452.4 Mt CO₂-e in the year to June 2026.
What is Australia's biggest source of emissions?
Energy remains central to Australia's emissions profile, with electricity generation, direct fuel combustion, transport and resource-sector activity all contributing. The relative importance depends on how sectors are grouped in the national accounts.
Are Australia's emissions falling?
Yes. Emissions for the year to March 2026 were 1.6% lower than the previous year and approximately 25% below 2005 levels. Progress differs substantially between sectors.
Why are Australia's electricity emissions falling?
Increasing renewable generation is displacing part of the electricity previously generated from coal and gas. Electricity emissions fell 3.7% in the year to March 2026.
What is Australia's 2030 emissions target?
Australia has committed to reduce greenhouse gas emissions by 43% below 2005 levels by 2030.
What is Australia's 2035 target?
Australia's 2035 target is to reduce net greenhouse gas emissions by 62–70% below 2005 levels.